
For the past few years, students in my first semester calculus physics laboratory have explored kinematics (and also a little dynamics) by building and launching model rockets. Working in groups, the students build Estes Big Bertha or Baby Bertha rockets from kits. Then, we travel to a local park to launch the rockets. The rockets carry an Arduino-based payload that samples and records the rocket’s (approximately) vertical acceleration during the launch. This data is then analyzed back in the lab using kinematic equations of motion to estimate the rockets velocity and position during the launch.
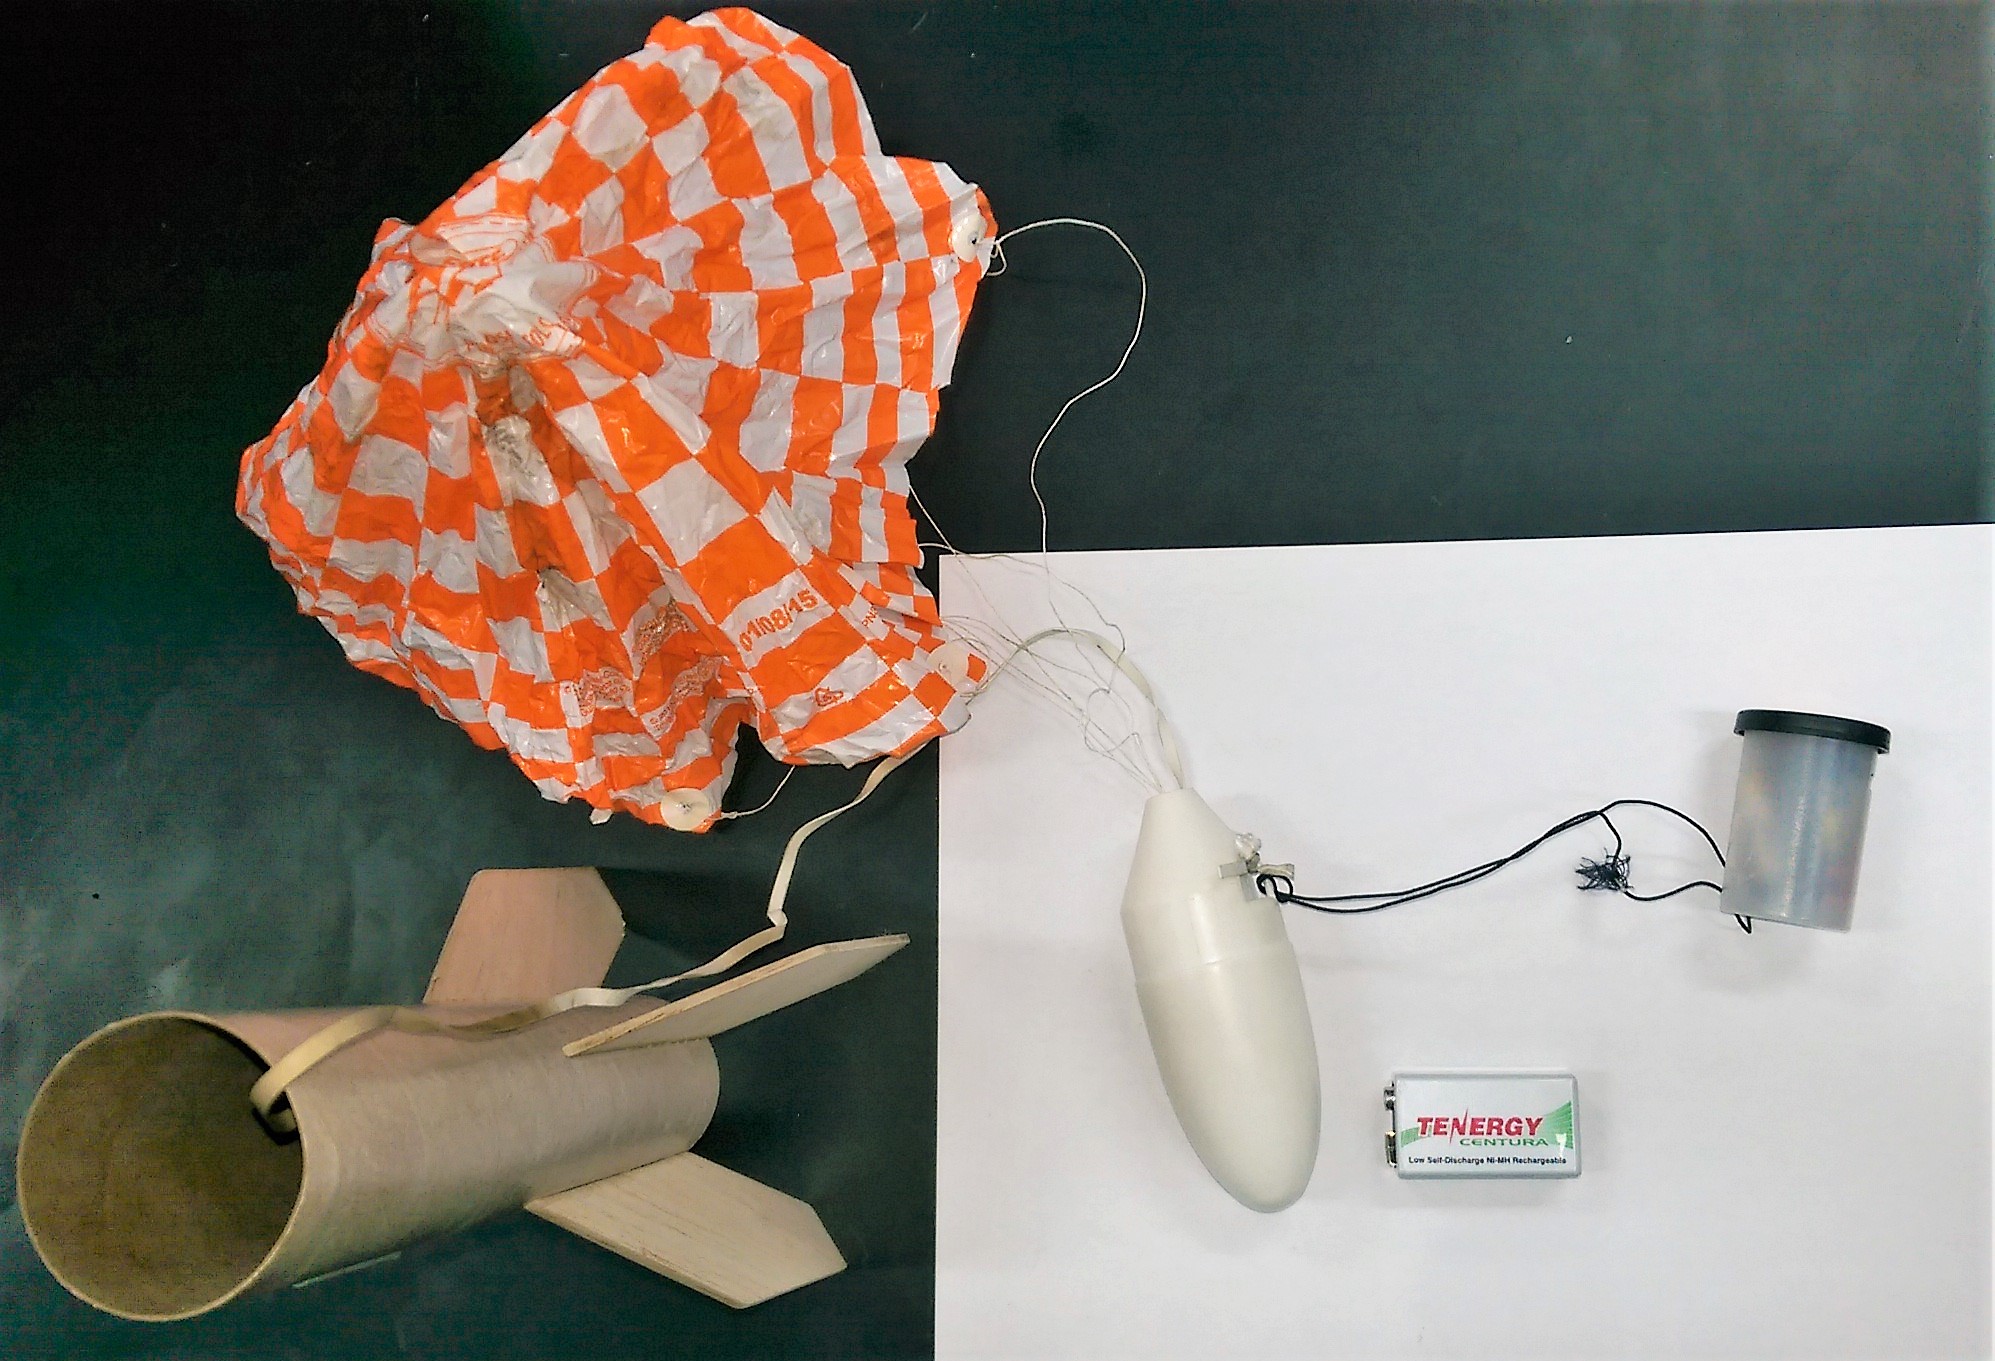
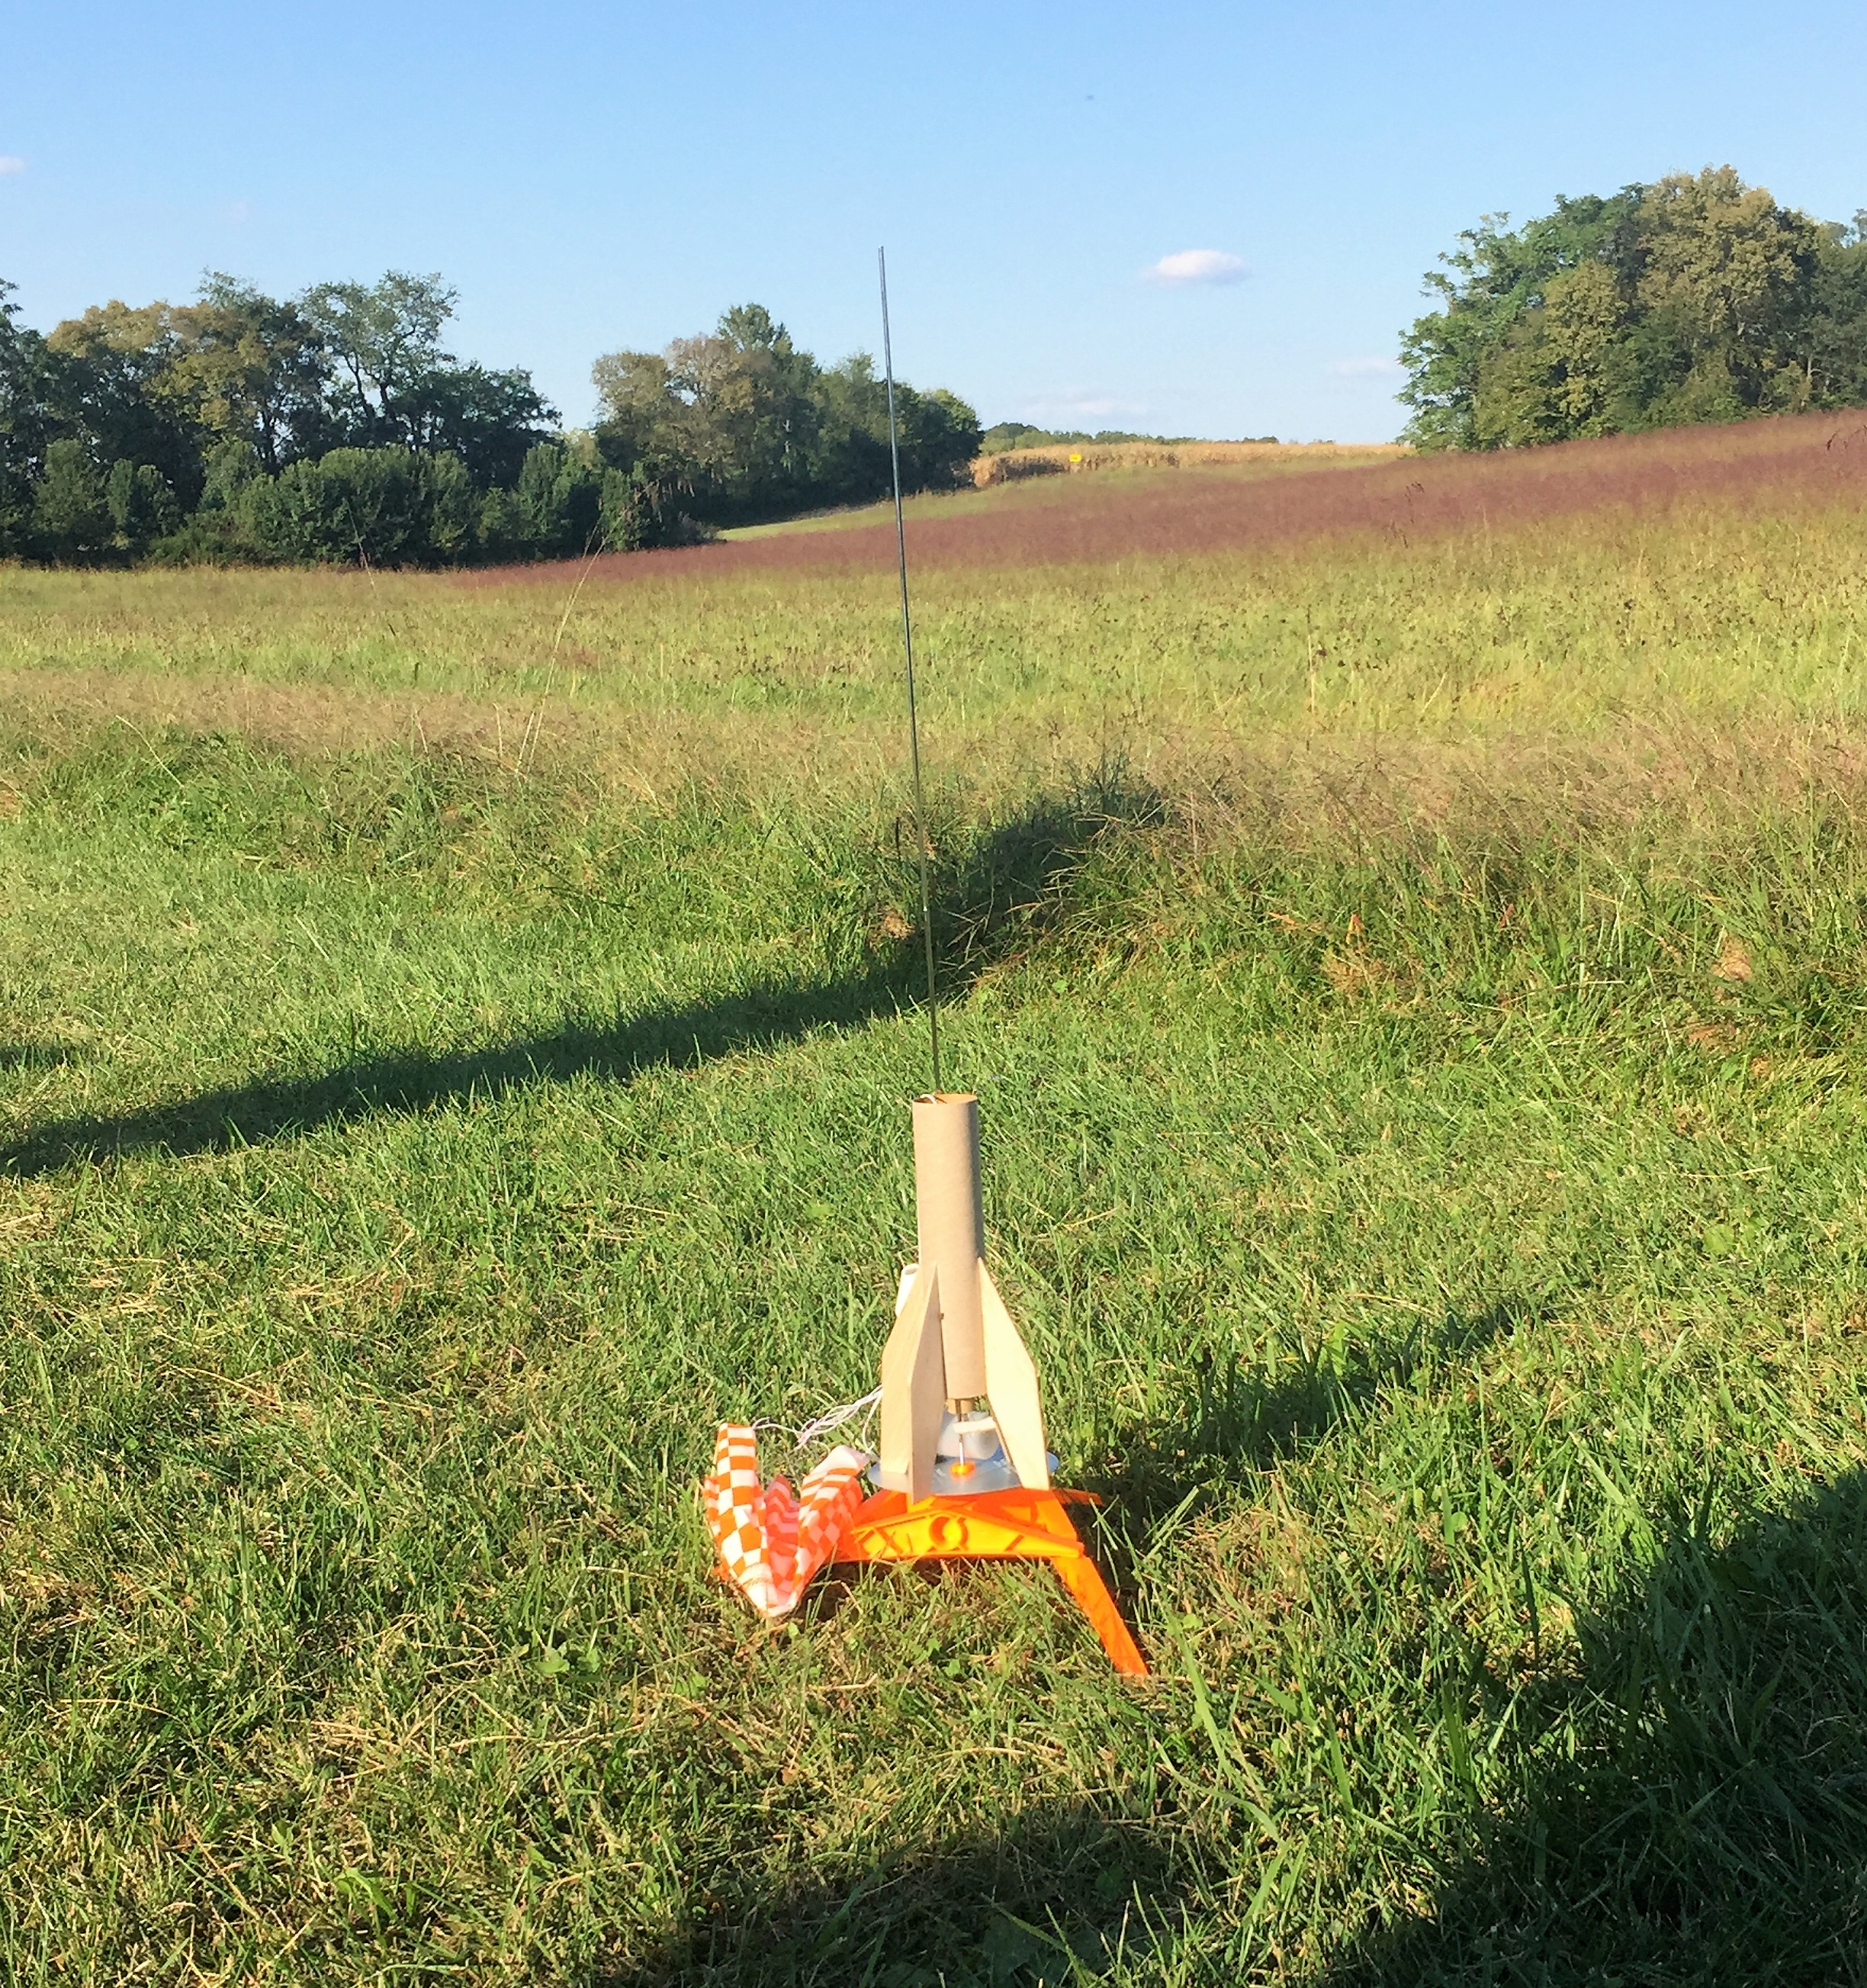
Here is a picture of a rocket with its payload attached via a short string to the nose cone. The payload fits in a film canister (remember those), which is small enough to fit inside the rocket. The payload is only 20.7 g. In comparison, a standard Arduino Uno R3 is 26.6 g. All together, the payload, a Big Bertha rocket, and an Estes C6-5 engine is about 110 g. This is just under the recommended maximum lift-off mass for the C6-5 engine (113 g).
The payload is composed of an Arduino Pro Mini, a SparkFun LIS331 accelerometer breakout board, a SparkFun OpenLog data logger, a small 110 mAh LiPo Battery, and a switch to activate the device.
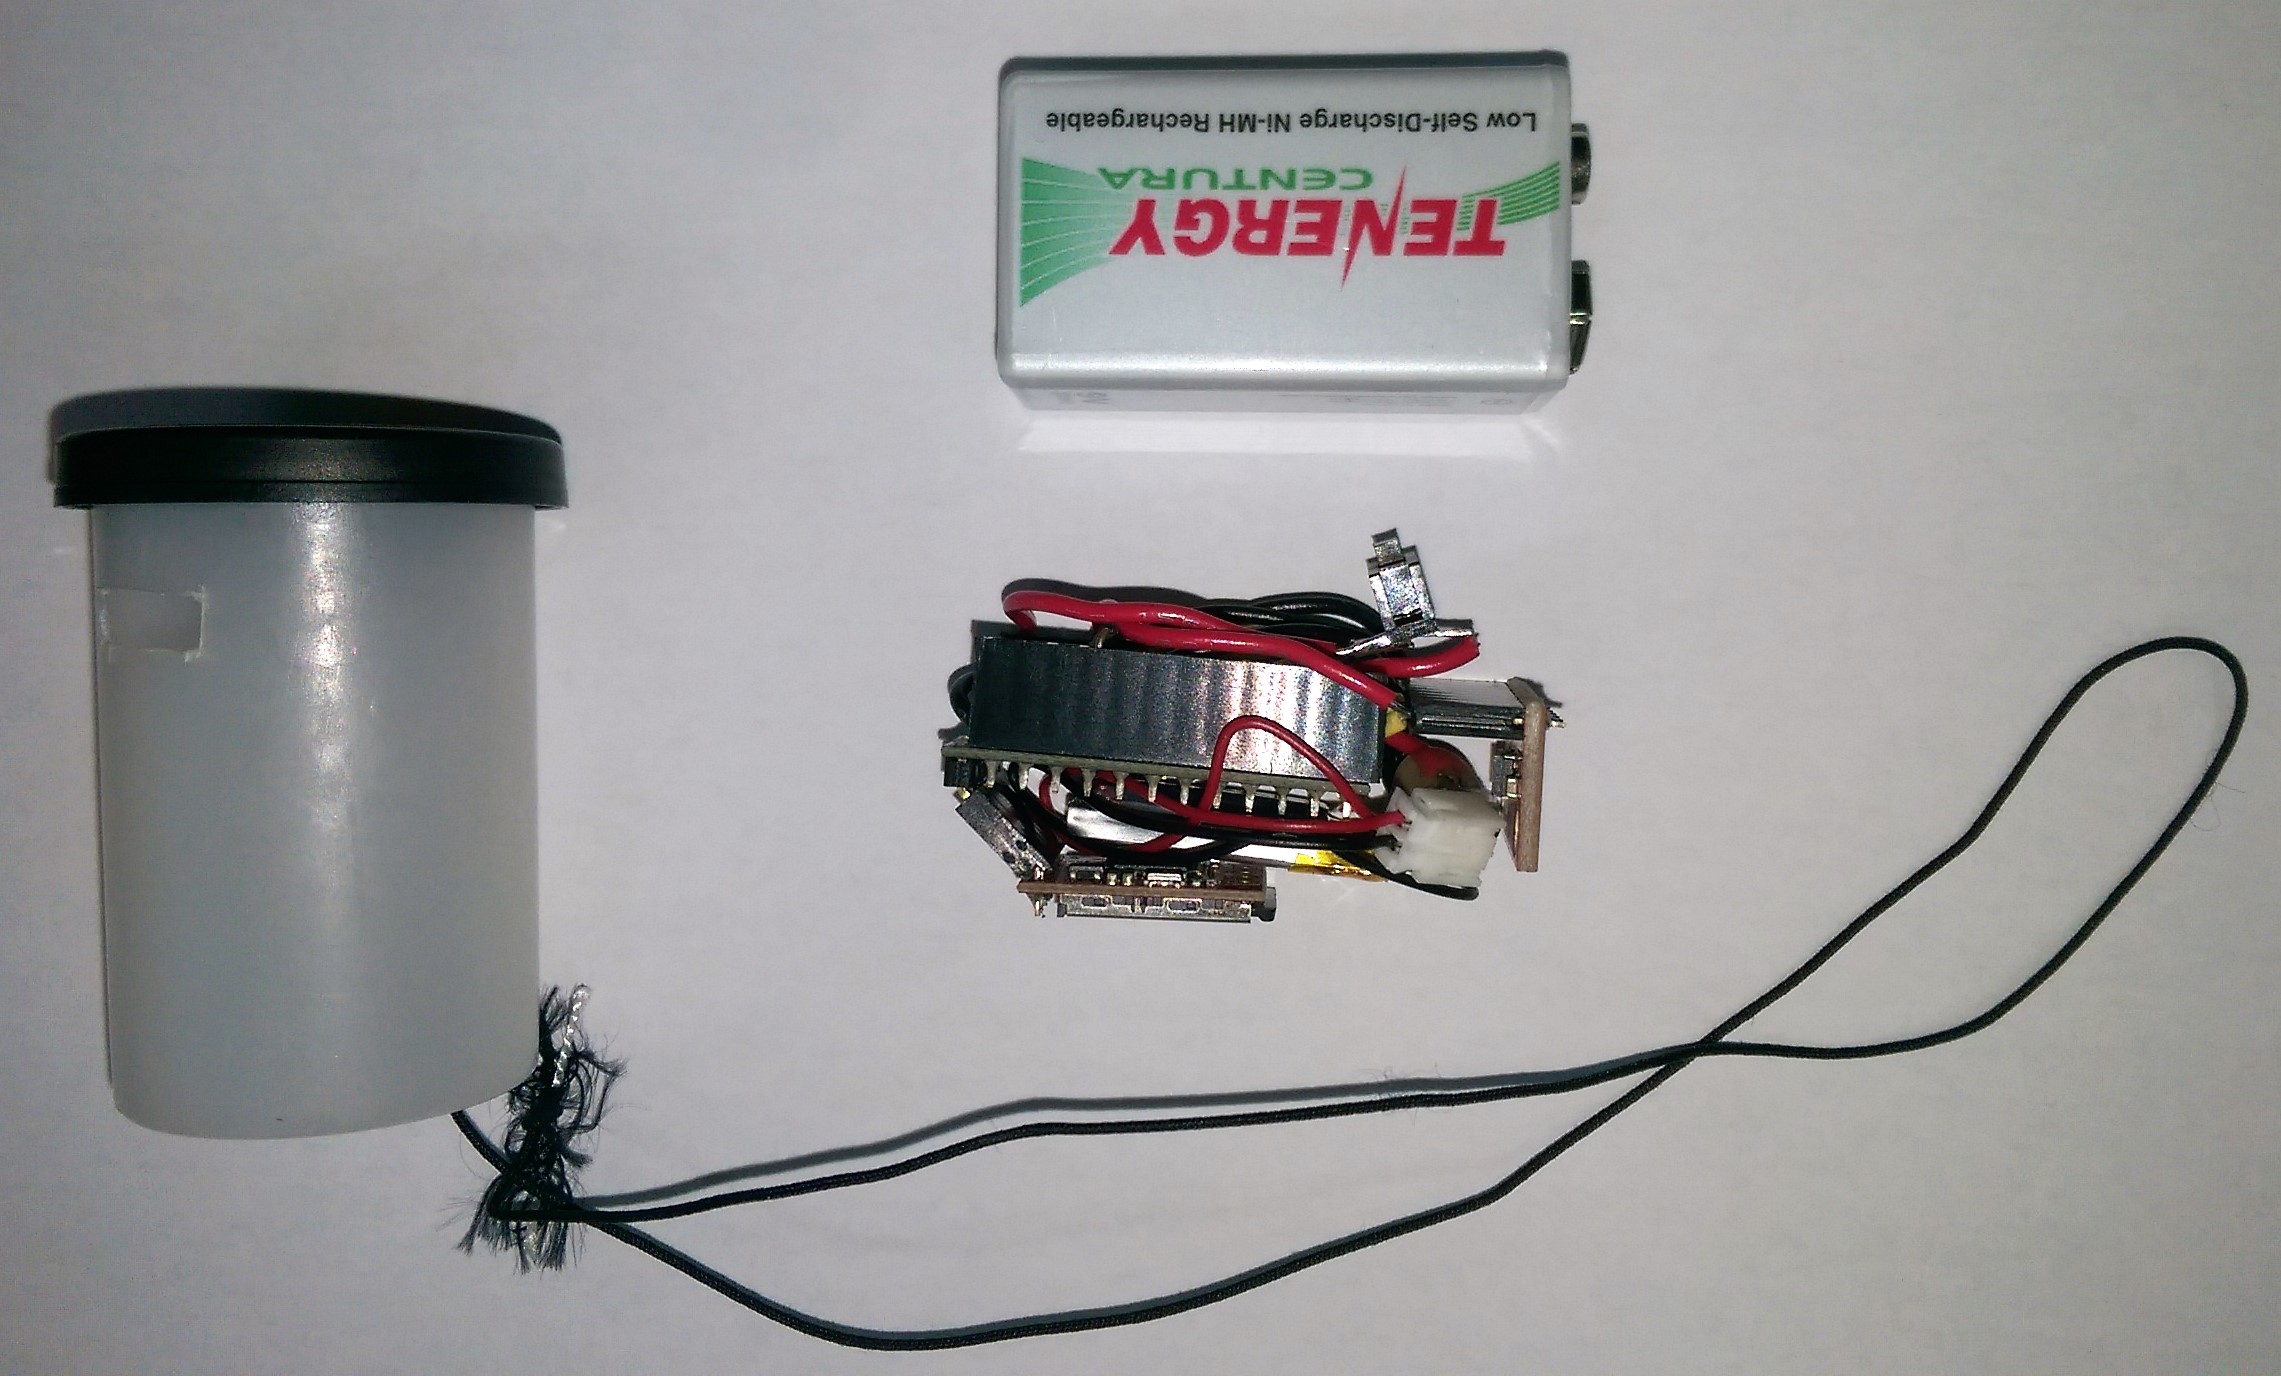
The payload is running an Arduino sketch that incorporates SparkFun code for the LIS331 accelerometer. The sketch can be downloaded using this link. Approximately 30 second after the payload is activated by the switch, the sketch starts sampling and logging timestamped (approximately) vertical acceleration data to a microSD card every 20-25 ms.
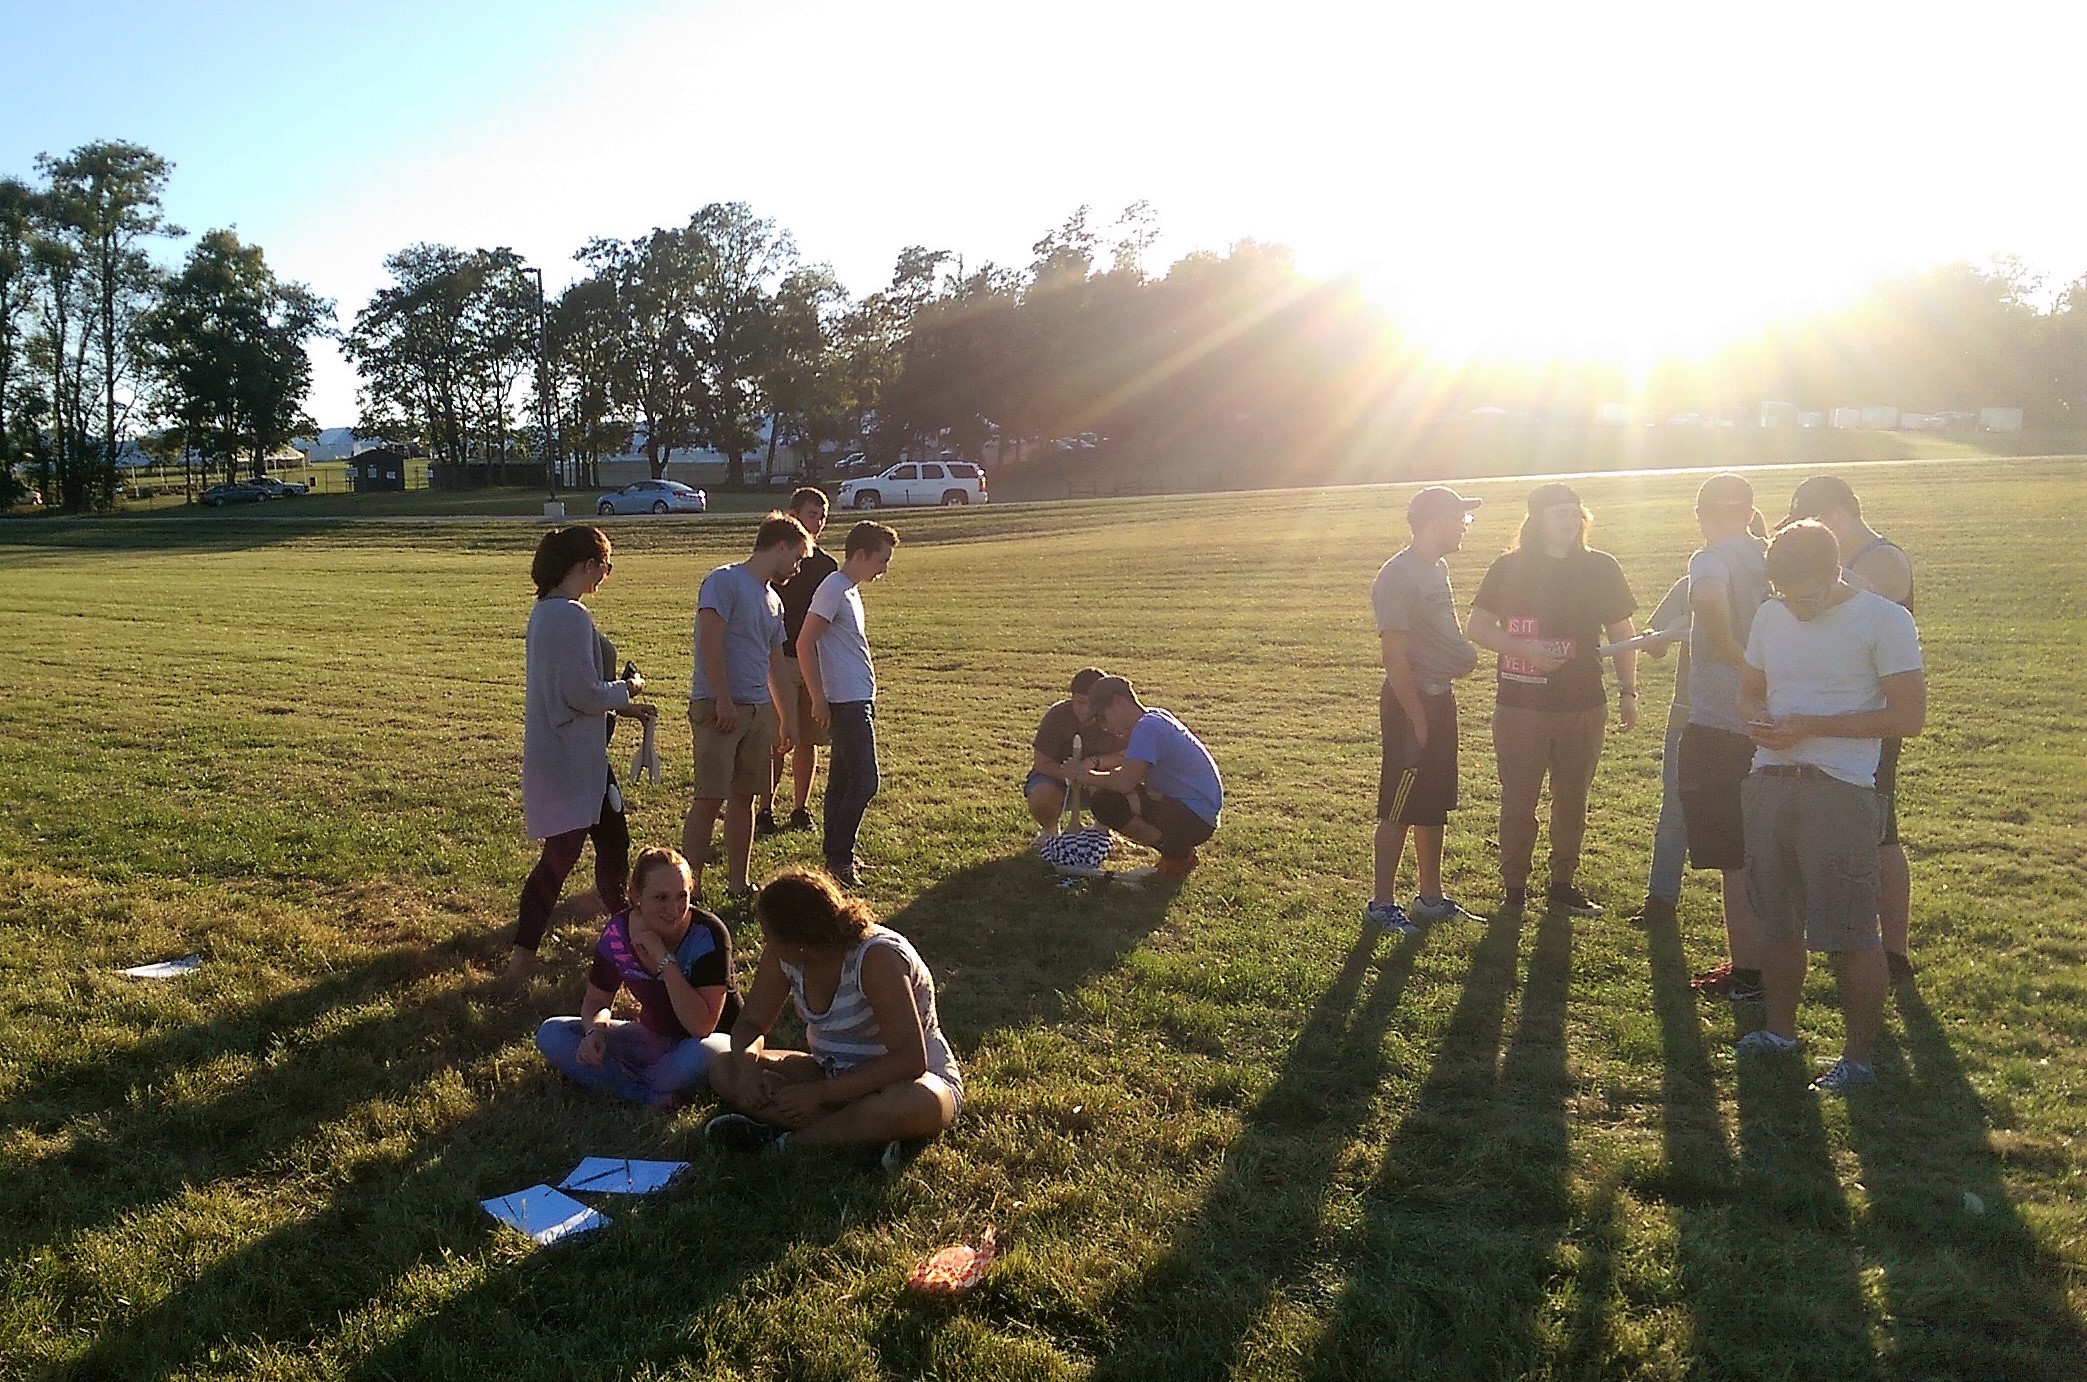
Here are some pictures from launch days at the park. Spending late afternoons in late September and early October outdoors launching rockets is the best. We utilized either Estes C6-5 or B6-4 engines. Here are links to C6-5 and B6-4 bulk engine packs that include ignitors and wadding.
The rocket is prepared for launch by installing an engine, an igniter, flame retardant wadding, and the parachute.
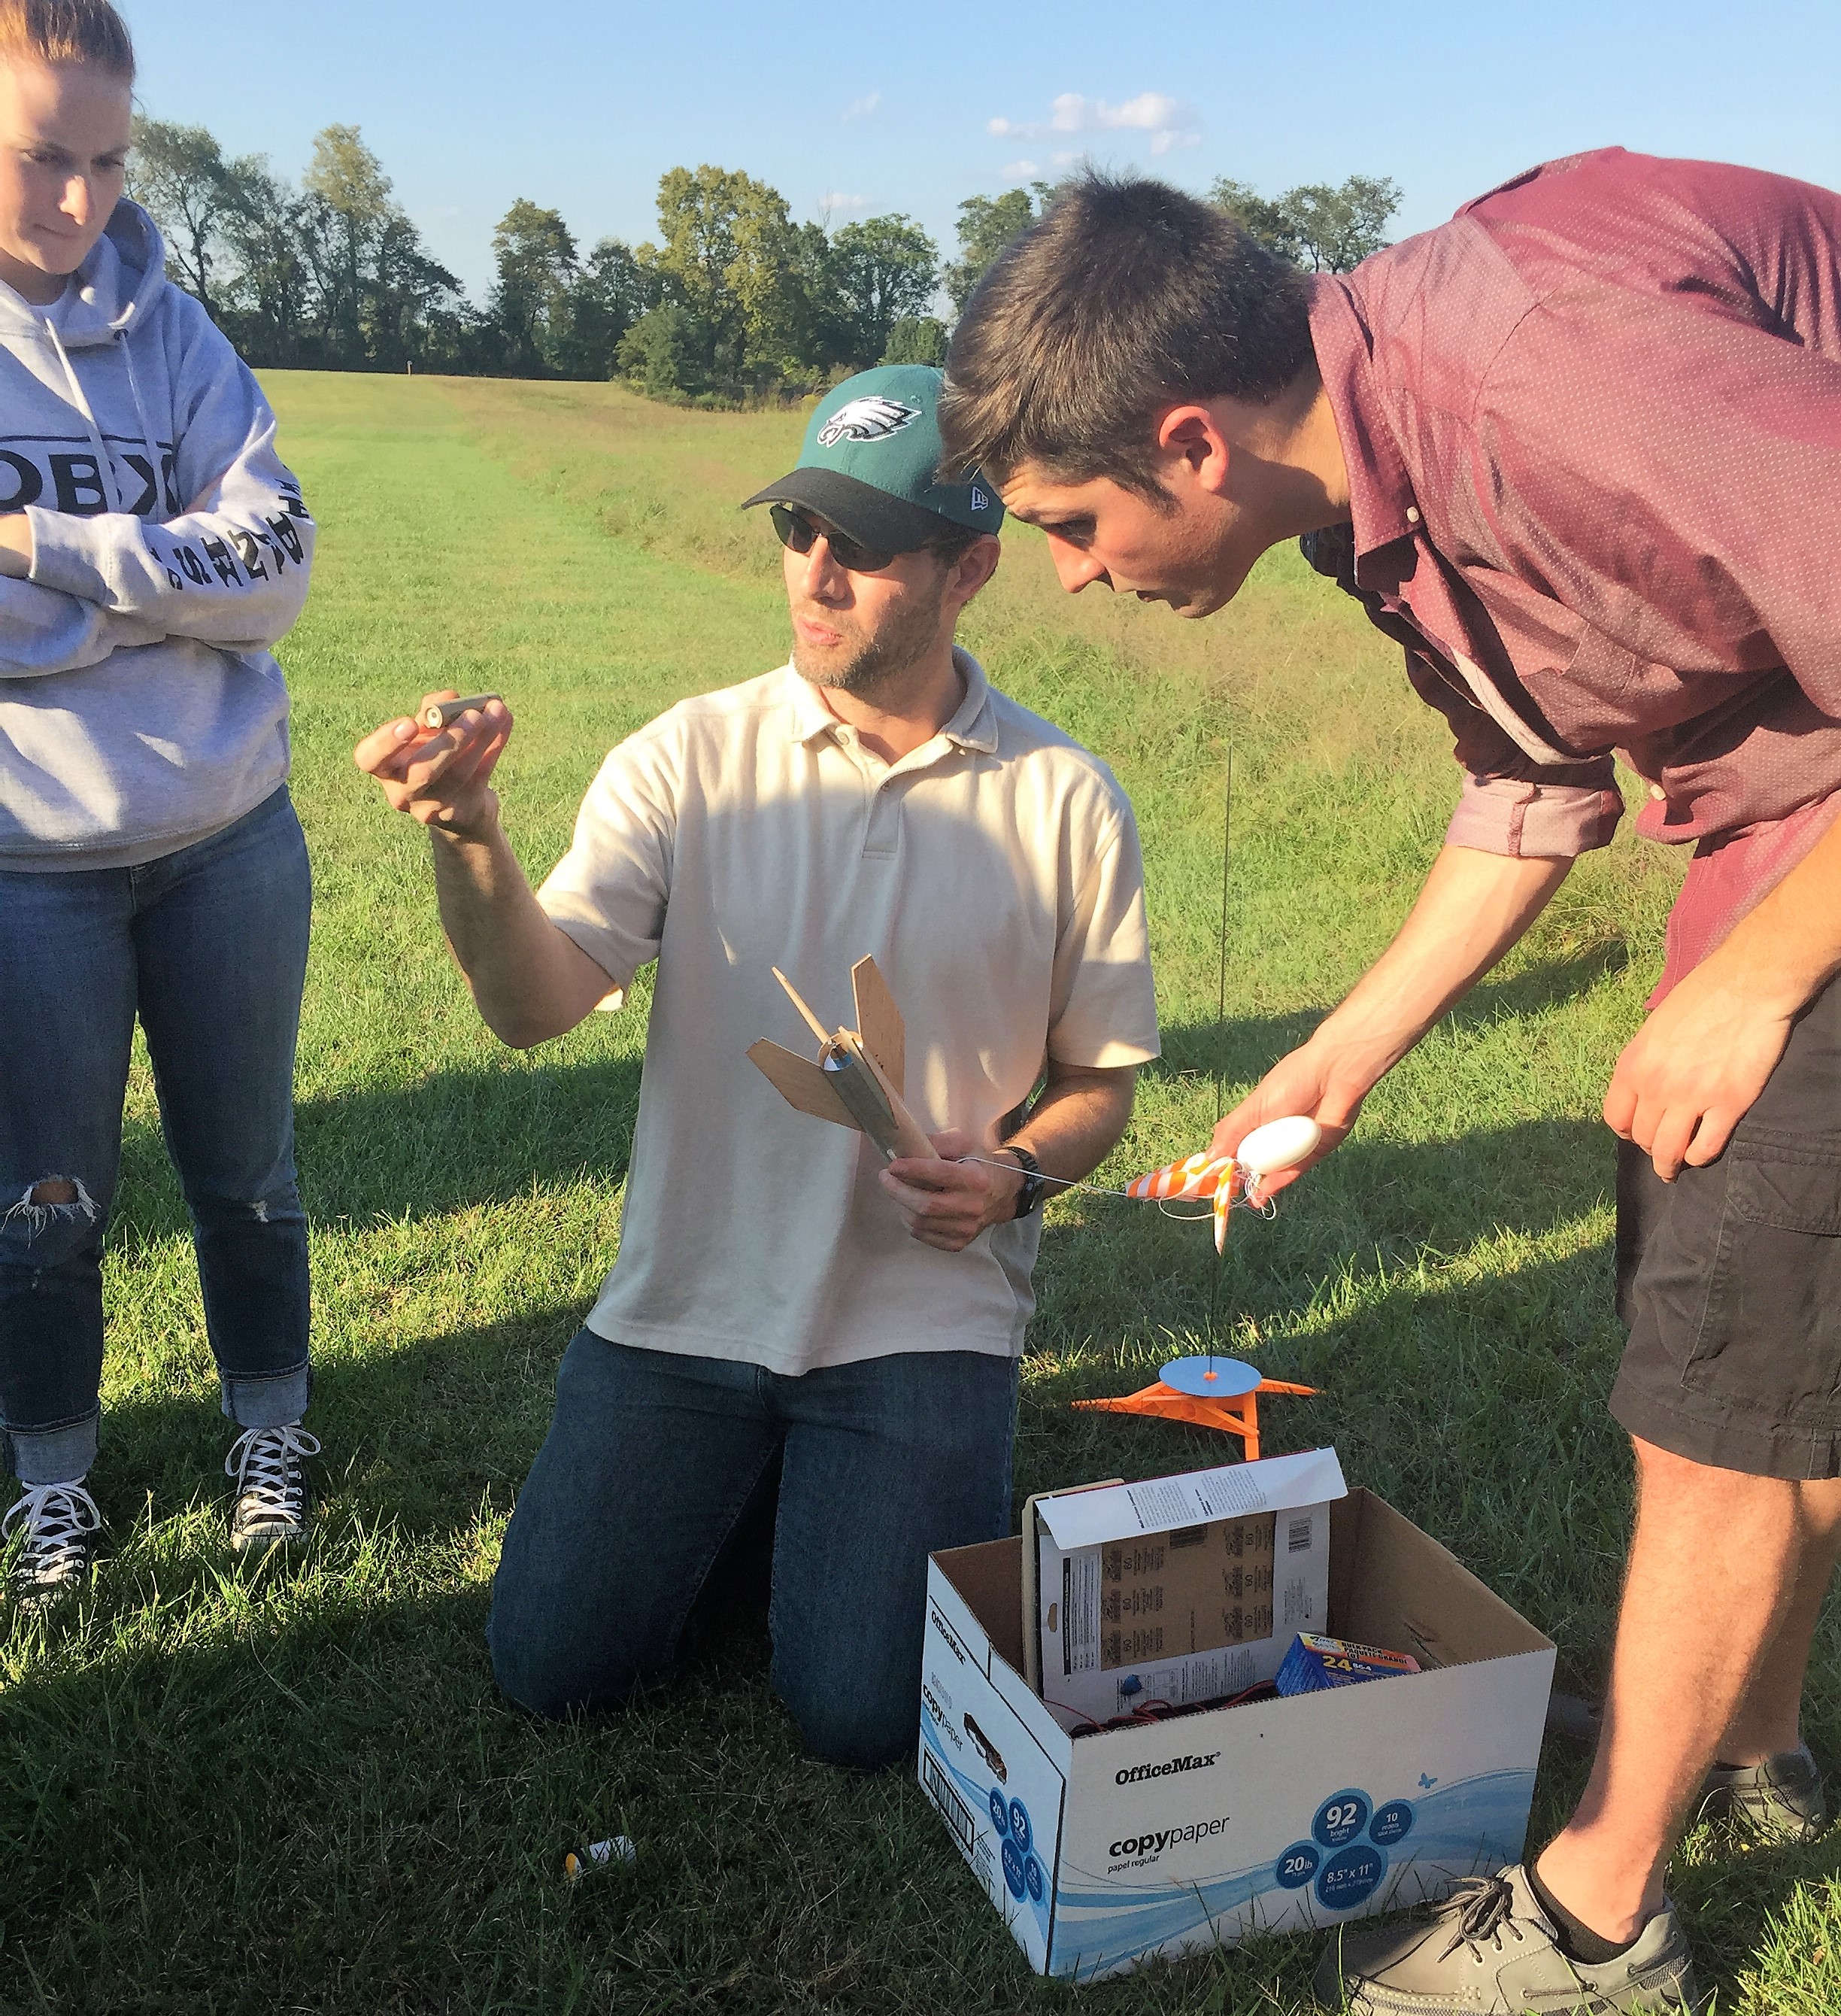
The nose cone is put in place after the payload is loaded. This happens after the rocket is put on the launch pad.
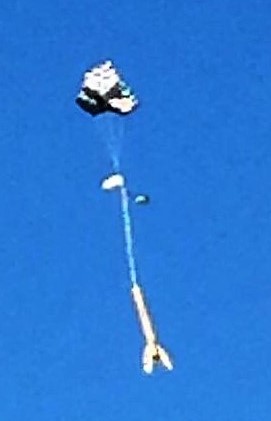
You can see the payload next to the nose cone in this close up of the rocket after its parachute deployed.
Data Analysis
The raw data stored on the microSD card after a launch is a time series of one-dimensional acceleration data. Students isolate and clean up the portion of the data set corresponding to the period of engine burn. The data is also scaled and shifted to convert from units of g’s to units of m/s2. Assuming the initial velocity (v0) and initial vertical position (y0) are zero and using the following definitions for average acceleration and average velocity, the acceleration time series is numerically integrated to yield velocity and potion.


When students do this, they are utilizing relationships between the kinematic quantities and the trapezoidal rule to numerically integrate, and they are also gaining experience with a real world data set which is discrete and somewhat messy. This is much better in my opinion than learning the calculus-based connections between acceleration, velocity, and position using the contrived polynomial descriptions of time-varying kinematic quantities often encountered in text books.
Below is an example data set from the launch of a Big Bertha with a C6-5 engine.
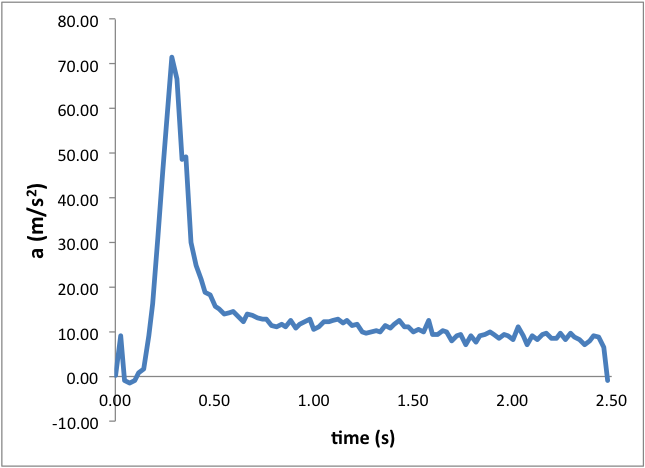
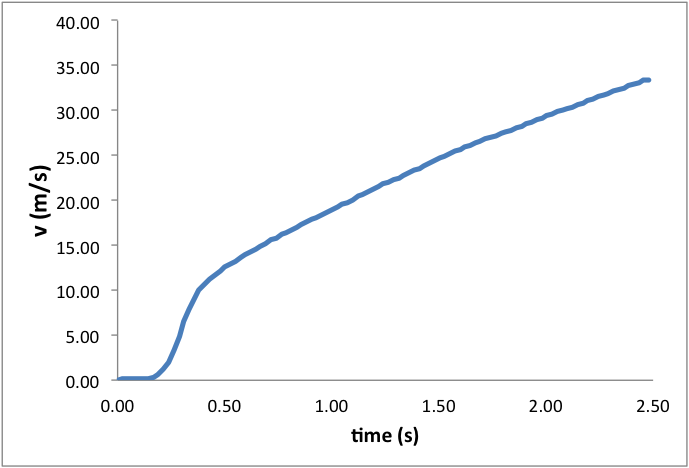
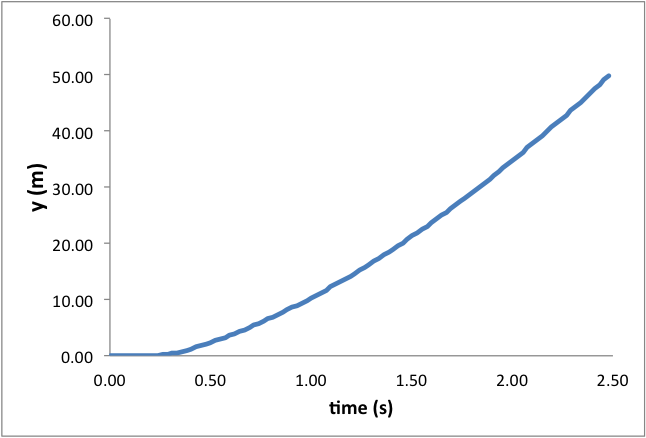
Students can use this data to make estimates of the rocket’s velocity and height at engine cut-off. The slight decrease in acceleration and the slope of the velocity curve during the sustained burn phase of the launch is evidence of velocity-dependent drag.
Assuming the rocket’s mass is constant during the launch (its not, its a rocket), the acceleration can be used with Newton’s second law to find the net force on the rocket. Below is this estimated net force plus the launch weight plotted for the same data set above. In the absence of friction this is equal to the engine thrust. Also shown is the thrust curve for a C6-5 rocket measured using a Vernier force probe and a static ground-based test apparatus I made.
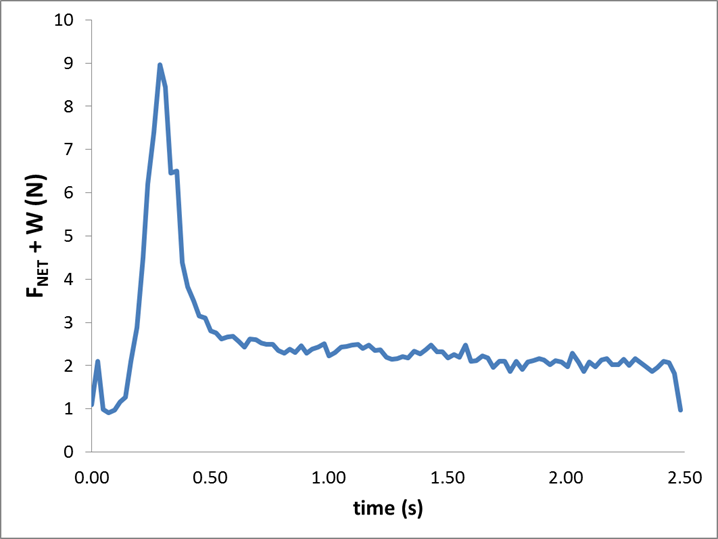
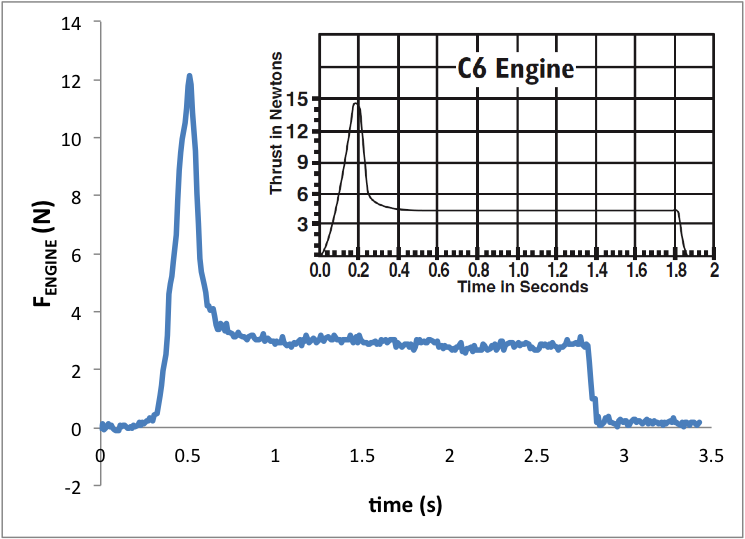
Notice that while there is good qualitative agreement between the two curves, there are notable differences. For one, the peak force is larger for the static thrust measurements. Why? Can the difference be attributed to drag? I doubt it. Also, the slight downward trend in the net force minus weight data is evidence that the drag increases as the velocity increases. The inset with the static thrust curve is a thrust curve for this engine provided by Estes. Notice that their peak thrust is larger than what we measured but the burn duration is shorter than what we measured.
Note that the total impulse of the engine can be calculated by numerically integrating the thrust curve. This can be compared to a value reported in the Estes documentation for this engine.
One More Thing
One interesting observation I made while reading student reports on this project this year is related to how students interpret “messy” data. Below are two quotes from two different student reports.
… we noticed a large dip in the beginning of the [acceleration] graph, then it started accelerating. This could be due to a malfunction in the device that was measuring our data or it could be that the rocket stopped burning fuel for a moment, then started burning again.
Due to the unreliability of [the] … raw data, the accelerometer actually appears to fluctuate causing two separate peaks in thrust.
Both of these statements show that students tend to think that “messy” data is due to some kind of malfunction instead of simply accepting that “messy” is part of reality.
